
A Clear-Eyed Look at Video Analytics Industry Stats (and Which Ones Are Marketing Noise).
Every video analytics pitch eventually reaches a slide with a big number—market size, shrink, or unsourced “accuracy.” The category is noisy, not empty. Here’s how to read primary sources, date every benchmark, and reject marketing theater.
AwareCam team9 min read
First principle: a statistic is only as good as its definition
Buyers are right to be skeptical. Know which sources are primary, which forecasts use different definitions, and which patterns are marketing theater. Below: verifiable figures with URLs and years. If we cannot verify a number, we omit it.
Before trusting any figure, ask four questions:
- Who measured it? Association survey, government statistical program, or commercial market-research firm?
- What exactly was counted? Shrink is not the same as theft. Property crime reported to police is not the same as retailer-reported shoplifting incidents. “Video analytics market” is not a single SKU.
- For which period? FY2022 shrink is not a 2026 operational fact.
- Can you open the source? If the percentage only exists in a vendor brochure, treat it as advertising.
Hold vendors—including us—to that standard.
Retail loss and theft: what reputable sources actually say
NRF’s last published industry shrink benchmark (FY2022)
The National Retail Federation’s National Retail Security Survey 2023 reported that the average shrink rate in FY2022 increased to 1.6%, up from 1.4% in FY2021, and stated that this shrink represented large industry-wide inventory loss when applied to total retail sales for 2022. That survey remains the latest NRF industry shrink-rate benchmark of its kind.
Source: https://nrf.com/research/national-retail-security-survey-2023
NRF stopped publishing that annual shrink-percentage report
This matters for buyers who still see “industry shrink is X%” recycled in 2025–2026 decks. Trade coverage in October 2024 reported that after more than three decades, NRF would not publish its annual shrink report that year; a broad shrink study was no longer sufficient. NRF pointed to the prior survey for the latest shrink stats and shifted toward theft-and-violence reporting. NRF has also explained why shrink alone is a poor ORC proxy: mixed loss drivers, inconsistent retailer calculations, and theft impacts that land outside classic shrink lines.
Sources: https://www.retaildive.com/news/no-nrf-annual-retail-shrink-report-2024/729009/ · https://nrf.com/blog/the-misperception-of-shrink-and-its-impact-on-organized-retail-crime
Noise pattern to reject: A 2026 deck that cites “industry shrink of 1.6%” as a fresh universal constant—or treats shrink as synonymous with external theft.
NRF + LPRC Impact of Retail Theft & Violence 2025
NRF’s newer study (press release dated October 28, 2025), conducted with the Loss Prevention Research Council, surveyed senior retail LP/security executives (70 retail companies representing 168 brands). Among the cited findings:
- Retailers reported an 18% increase in the average number of shoplifting incidents per year in 2024 versus 2023.
- Threats or acts of violence during shoplifting or theft events increased 17% over that same period.
- More than half of retailers surveyed reported increases, over the prior 12 months, in ORC-linked activity across several vectors—including phone scams (70%), digital/ecommerce frauds (55%), shoplifting and merchandise theft (52%), and cargo/supply chain thefts (50%).
- 64% of retailers said they reported less than half of their store-related theft incidents to law enforcement, with lack of law enforcement response cited as the primary reason.
Retailers also reported increasing layered security measures, including cameras.
Sources: https://nrf.com/media-center/press-releases/new-study-finds-retailers-continue-to-contend-with-rising-levels-of-theft-and-violence · https://nrf.com/research/the-impact-of-retail-theft-violence-2025
How to use this well: These are survey answers from the retailers in the sample.
Government crime stats: a different lens
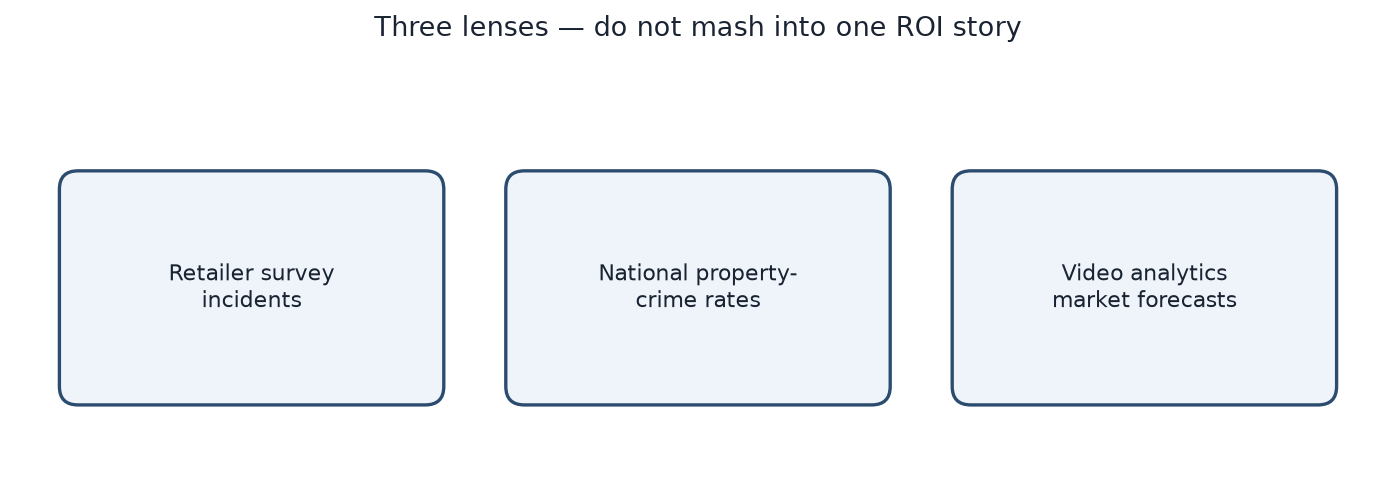
Do not mash government rates together with retailer surveys into one fake causal story.
BJS / FBI NIBRS estimates for 2024
The Bureau of Justice Statistics report Crime Known to Law Enforcement, 2024 (March 2026, NCJ 310856), based on the BJS/FBI NIBRS Estimation Program, found that the national property offense rate decreased from 2,019.7 per 100,000 persons in 2023 to 1,835.1 per 100,000 in 2024—a decline of 9%. Larceny-theft offense rates also fell over that period (from 1,431.9 to 1,334.5 per 100,000).
Source: https://bjs.ojp.gov/document/ckle24.pdf
FBI UCR summary note on shoplifting
The FBI’s UCR Summary of Reported Crimes in the Nation, 2024 states that in 2023 and 2024, shoplifting surpassed larceny-theft from motor vehicles as the most common specified larceny-theft type (excluding the broad “all other” category).
Noise pattern to reject: Combining “national property crime is down” with “retailers report more shoplifting incidents” into a single simplistic narrative—or using either figure as a fake proof point for a specific software ROI. Different systems measure different things. Both can be true in the same year.
Video analytics market sizes: real forecasts, incompatible billboards
Commercial research firms publish global “video analytics market” estimates. They are real research products—and they disagree because scope, methodology, and forecast windows differ. Always re-check the firm’s page for the latest revision:
- Grand View Research estimated the global video analytics market at USD 12.71 billion in 2024, projecting USD 37.84 billion by 2030, at a 19.5% CAGR (2025–2030). Source: https://www.grandviewresearch.com/industry-analysis/video-analytics-market
- MarketsandMarkets projected the market to grow from USD 14.65 billion in 2026 to USD 41.39 billion by 2031, at a 23.1% CAGR. Source: https://www.marketsandmarkets.com/PressReleases/iva.asp Report page: https://www.marketsandmarkets.com/Market-Reports/intelligent-video-analytics-market-778.html
- Fortune Business Insights reported the market valued at USD 12.29 billion in 2025, projecting growth from USD 14.81 billion in 2026 to USD 65.08 billion by 2034, at a 20.30% CAGR. Source: https://www.fortunebusinessinsights.com/industry-reports/video-analytics-market-101114
Takeaway: Category growth is broadly expected. Exact billions and CAGRs are not interchangeable. Picking the largest headline without firm, year, and definition is category inflation.
Noise pattern to reject: “The market will be $X billion, therefore buy our SKU.” Forecasts do not validate alert quality on your cameras.
Alarm fatigue and verification: use carefully
Unverified alerts create response waste in any monitoring stack—legacy alarms or video. Ask how a vendor tunes rules so staff still open alerts in week four.
The Monitoring Association’s ANSI/TMA-AVS-01 standard (alarm verification scoring for emergency centers) is one industry example of prioritizing verified activity over raw activations—useful as a mindset for video alert design, not as a claim about AwareCam accuracy.
Sources: https://doi.org/10.1016/j.irle.2020.105930 · https://tma.us/standards/tma-avs-01-alarm-validation-standard/
Boundary: These sources are about alarm validation—not published accuracy rates for any video analytics vendor. Lesson for buyers: alert trust matters; mature operations invest in verification, not maximizing pings.
Prefer primary sources. Date every benchmark. Separate market forecasts from store outcomes.
Marketing-noise patterns checklist
Print this for vendor meetings:
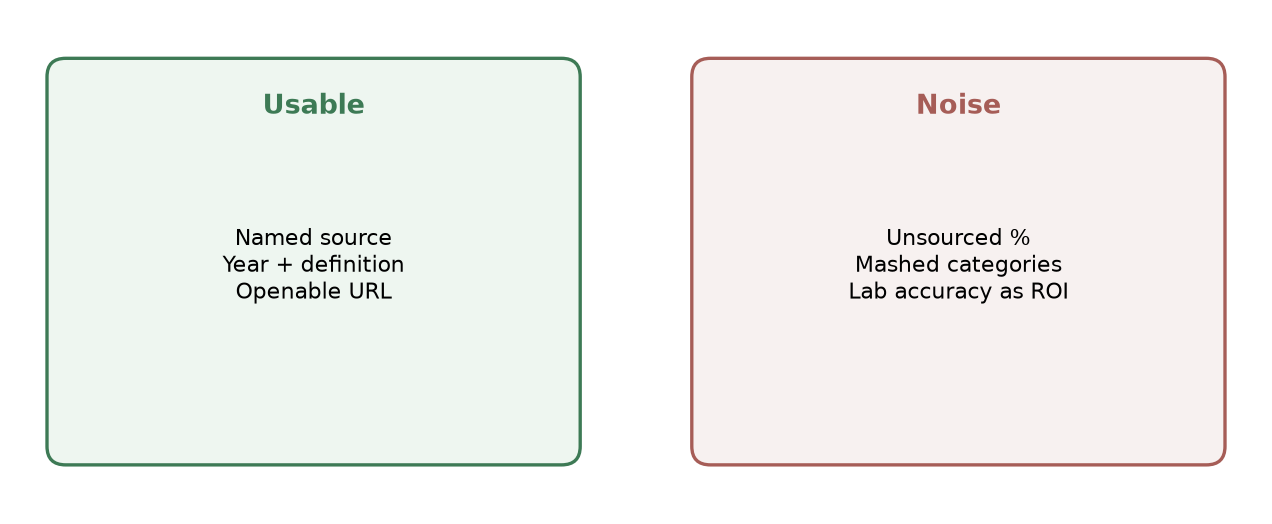
- Unsourced percentages — “Reduce shrink 30%” with no study, sample, or year.
- Category inflation — Market-size slides that omit firm name, definition, and forecast window—or quietly pick the most dramatic forecast among peers.
- Metric mashups — Mixing NRF survey incident changes, national UCR/NIBRS rates, and a single store’s shrink into one fake causal story.
- Vanity dashboards as proof — Heatmaps and people-count charts offered as evidence of LP outcomes they do not measure.
- Lab accuracy without deployment context — Precision/recall from a curated dataset presented as guaranteed store performance.
- Stale benchmarks sold as current — FY2022 shrink figures presented as this quarter’s industry truth without dating them.
- Fear without operations — Crime headlines with no discussion of event design, existing cameras, notification routing, or tuning ownership.
If a claim fails the checklist, ask for a primary source or strike it from the evaluation.
What to ask a vendor
Replace brochure statistics with operational evidence:
- Does the system work on cameras you already have?
- Are events defined in your SOP language?
- Do alerts include enough context to act?
- What is the plan for false-alert retirement after week one?
- How will multi-site templates stay consistent?
- Is commercial scope a scoped proposal after a camera and workflow review, not a public price list?
Those questions produce better decisions than a duel of CAGRs.
Closing
Judge platforms by whether they make the cameras you already paid for more useful—not by which firm’s headline forecast was largest this year.
Sources
- NRF, National Retail Security Survey 2023 — https://nrf.com/research/national-retail-security-survey-2023
- Retail Dive, “After more than 3 decades, NRF won’t publish its annual shrink report this year” (Oct. 7, 2024) — https://www.retaildive.com/news/no-nrf-annual-retail-shrink-report-2024/729009/
- NRF, “The misperception of shrink and its impact on organized retail crime” — https://nrf.com/blog/the-misperception-of-shrink-and-its-impact-on-organized-retail-crime
- NRF press release, “New Study Finds Retailers Continue to Contend with Rising Levels of Theft & Violence” (Oct. 28, 2025) — https://nrf.com/media-center/press-releases/new-study-finds-retailers-continue-to-contend-with-rising-levels-of-theft-and-violence
- NRF, The Impact of Retail Theft & Violence 2025 — https://nrf.com/research/the-impact-of-retail-theft-violence-2025
- BJS, Crime Known to Law Enforcement, 2024 (NCJ 310856) — https://bjs.ojp.gov/document/ckle24.pdf
- FBI, UCR Summary of Reported Crimes in the Nation, 2024 — https://cde.ucr.cjis.gov/LATEST/resources/reports/UCR%20Summary%20of%20Reported%20Crimes%20in%20the%20Nation%202024.pdf
- Grand View Research, Video Analytics Market — https://www.grandviewresearch.com/industry-analysis/video-analytics-market
- MarketsandMarkets press release, Video Analytics Market worth USD 41.39 billion by 2031 — https://www.marketsandmarkets.com/PressReleases/iva.asp
- MarketsandMarkets report page — https://www.marketsandmarkets.com/Market-Reports/intelligent-video-analytics-market-778.html
- Fortune Business Insights, Video Analytics Market — https://www.fortunebusinessinsights.com/industry-reports/video-analytics-market-101114
- The Monitoring Association, ANSI/TMA-AVS-01 — https://tma.us/standards/tma-avs-01-alarm-validation-standard/